
Jackson enters Q1 2026 as one of the most affordable rental markets Rental Beast tracks. Rents are moving upward quarter-over-quarter across all property types, concessions are below the national average, and the monthly cost of owning remains well above renting. For renter clients in Mississippi's capital, this is a market defined by accessibility and steady momentum.
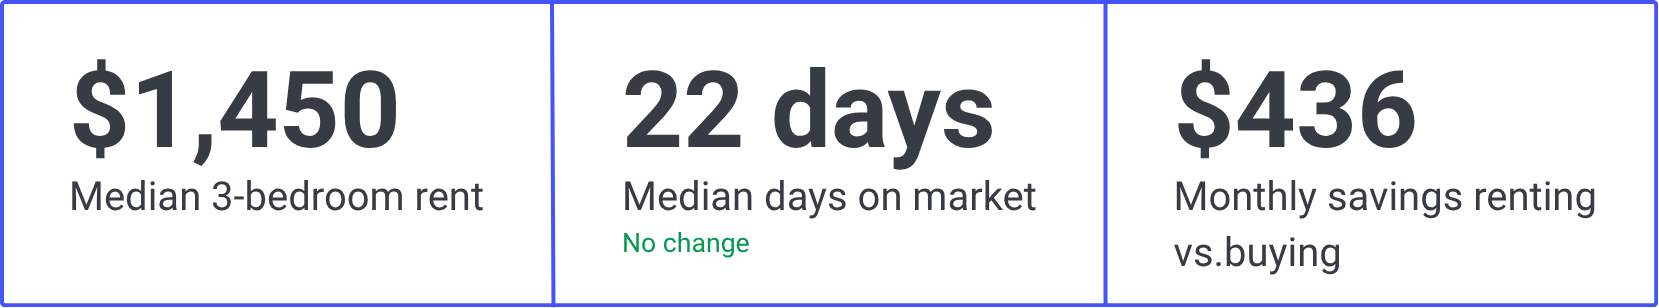
Rents in Jackson are climbing modestly this quarter. One-bedrooms rose 3.4% quarter-over-quarter to $1,034, 2-bedrooms are up 4.3% to $1,199, and 3-bedrooms held flat at $1,450. Single-family rentals are unchanged at $1,500 while multi-family units increased 2.1% to $1,225. With data available beginning Q2 2025, Jackson's rent picture reflects a market that has been building steady upward momentum over the past several quarters.
.png)
Jackson's concession rate came in at 34.4% in Q1 2026, up 51.2% quarter-over-quarter but still below the national rate of 41.8%. Roughly one in three listings is offering some form of incentive, giving renter clients a reasonable chance of securing a concession if they ask. That said, Jackson is not as concession-heavy as many other markets Rental Beast tracks, so expectations should be calibrated accordingly.
Days on market came in at 22 days overall, with single-family properties moving in just 16 days and multi-family at 23 days. The single-family segment is moving notably faster, a pattern consistent with several other markets Rental Beast tracks this quarter. Renter clients targeting houses should be prepared to move quickly.
.png)
Property managers in the region are broadly expecting stability heading into Q2. The majority anticipate rents will remain the same over the next six months, with a small share expecting increases and a slightly larger share expecting decreases. Applicant flow is mixed, with a meaningful share reporting fewer applicants than usual and a small share reporting more.
.png)
Despite Jackson's low rent levels, owning still costs meaningfully more than renting. The monthly cost of owning a median-priced home ($300,000 list price as of March 2026) comes to approximately $1,886 per month, compared to a 3-bedroom median rent of $1,450. That is a gap of $436 per month in favor of renting, down slightly from $460 in Q4 2025.
.png)
Calculations use Q1 2026 rents and a mortgage with 20% down, a 6.2% interest rate, taxes, and insurance to show the cost of renting versus buying.
.png)
Rental data used in this report are sourced and catalogued directly by Rental Beast, unless otherwise noted. Rental Beast listing data covers a range of rental property types and owner types operating within the long-term rental market (generally considered to be leases with a minimum of three months). Single-family rentals are considered to be properties with 4 or fewer units. Multifamily is more than 4 doors. Unless otherwise noted, our analysis uses Jackson, MS as the geographical unit.
Rents are calculated based on these listings. Days on market (DOM) and concession analysis are based on these listings, with some data sources excluded due to DOM and concession info being unavailable or deemed to be unreliable. Concessions are incentives that entice renters to sign a lease (e.g., one month free, a gift card, etc.). Our sentiment survey is based on phone conversations during Q1 2026 with rental building and community managers and property managers. Questions and answer choices:
DISCLAIMER. This report attempts to provide reliable and useful information; however, there is no guarantee that the information or other content in this document is accurate, current or suitable for any particular purpose. All content is subject to change without notice. All content is provided on an “as is” basis, with no warranties of any kind whatsoever. Rental data used in this report are sourced and catalogued directly by Rental Beast, unless otherwise noted. Our analysis uses MSA as the geographical unit and is not reflective of all-U.S. measures. Information from this document may be used with proper attribution.
©2026 by Rental Beast

