
Chicago's Q1 2026 data is turning heads. A 10.3% year-over-year jump in 3-bedroom rents is the sharpest gain in that segment of any tracked market this quarter, and it comes alongside dramatically faster leasing velocity, falling concessions, and the most bullish property manager sentiment in the dataset. The window for renter-favorable conditions in Chicago is narrowing quickly.
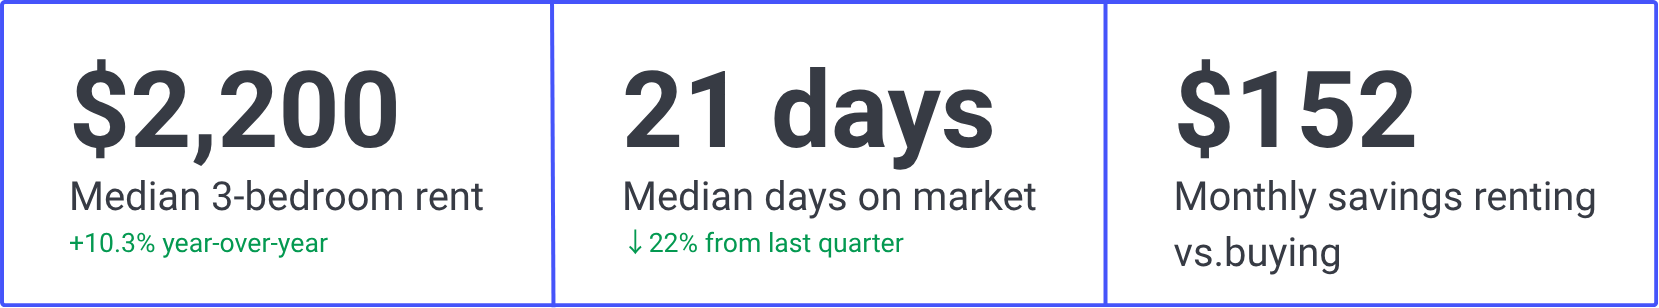
Rent growth is broad-based in Chicago this quarter, but 3-bedroom units are the outlier. A 10.3% year-over-year increase to $2,200 is the largest gain in that segment of any market tracked in the Q1 2026 dataset, and it's happening alongside, not instead of, gains across other unit types.
.png)
Chicago's concession rate fell 9.7 points to 33.4%, now below the national median of 41.8% and the steepest quarterly drop among larger markets. At the same time, days on market fell 22% to 21 days overall, with single-family rentals leasing in just 19 days. These two signals together tell a consistent story: the market is tightening and renter leverage is shrinking.
.png)
Property manager sentiment in Chicago is the most bullish in Q1 2026 of the markets surveyed by Rental Beast. 41.8% expect rents to increase over the next six months. And 28.4% report more applicants than usual, against just 8.5% reporting fewer. Demand is building, not flattening.
.png)
The monthly cost of owning a median-priced home ($360,000 list price as of March 2026) comes to approximately $2,352 per month, compared to a 3-bedroom median rent of $2,200. That is a gap of just $152 per month in favor of renting, down from $484 a year ago. For clients who are close to purchase-ready, this is a time-sensitive conversation.
.png)
Calculations use Q1 2026 rents and a mortgage with 20% down, a 6.2% interest rate, taxes, and insurance to show the cost of renting versus buying.
.png)
Rental data used in this report are sourced and catalogued directly by Rental Beast, unless otherwise noted. Rental Beast listing data covers a range of rental property types and owner types operating within the long-term rental market (generally considered to be leases with a minimum of three months). Single-family rentals (SFR) are considered to be properties with 4 or fewer units. Multifamily (MF) is more than 4 doors. Unless otherwise noted, our analysis uses the Chicago-Naperville-Elgin, IL, metropolitan statistical area (MSA) as the geographical unit.
Rents are calculated based on these listings. Days on market (DOM) and concession analysis are based on these listings, with some data sources excluded due to DOM and concession info being unavailable or deemed to be unreliable. Concessions are incentives that entice renters to sign a lease (e.g., one month free, a gift card, etc.).
Our sentiment survey is based on phone conversations during Q1 2026 with rental building and community managers and property managers. Questions and answer choices:
DISCLAIMER. This report attempts to provide reliable and useful information; however, there is no guarantee that the information or other content in this document is accurate, current or suitable for any particular purpose. All content is subject to change without notice. All content is provided on an “as is” basis, with no warranties of any kind whatsoever. Rental data used in this report are sourced and catalogued directly by Rental Beast, unless otherwise noted. Our analysis uses MSA as the geographical unit and is not reflective of all-U.S. measures. Information from this document may be used with proper attribution.
©2026 by Rental Beast

